Monitor and Troubleshoot - Part 2
In this exercise you will complete the following tasks:
- Find specific errors in the application.
- Troubleshoot node issues.
Find specific errors in the application
AppDynamics makes it easy to find errors and exceptions within your application. You can use the Errors dashboard to see transactions snapshots with errors and find the exceptions that are occurring most often by following these steps.
1 . Click on the Troubleshoot option on the left menu.
2 . Click on the Errors option on the left menu.
3 . Explore a few of the error transaction snapshots.
4 . Click on the Exceptions tab to see exceptions grouped by type.
 .
.
The Exceptions tab shows you what types of exceptions are occurring the most within the application so you can prioritize remediating the ones having the most impact.
At a glance you can see the name and summary for each exception type as well as:
1 . The exceptions per minute.
2 . The total number of exceptions.
3 . The Tier where the exceptions are occurring.
4 . Double-click on the MySQLIntegrityConstraintViolationException type.
 .
.
The overview dashboard for the MySQLIntegrityConstraintViolationException type:
1 . Defaults to the view showing you the list of snapshots where this type of exception has occurred.
2 . The tab labeled Stack Traces for this Exception shows you an aggregated list of the unique stack traces generated by this exception type.
3 . Double-click on one of the snapshots for the exception to open the snapshot.
 .
.
When you open an error snapshot from the exceptions screen, the snapshot opens to the specific segment within the snapshot where the error occurred.
1 . When an exit call has an error or exception it will be shown in red text.
2 . Drilling into the exit call shows you the details of the error or exception.
3 . To see the full stack trace of the exception, click on the Error Details at the top right.
You can read more about Errors and Exceptions here.
 .
.
 .
.
Troubleshoot node issues
AppDynamics provides visual indicators throughout the UI, which makes it easy to recognize issues and understand where they are. The Application Dashboard shows there is a problem with a Node in the Insurance-Services Tier.
You can see indicators of Node issues in three areas on the Application Dashboard.
1 . The Tier icon on the Flow Map changes color to indicate an issue with the Tier or one of its Nodes.
2 . The Events panel shows Health Rule Violations, including those related to Node Health.
3 . The Node Health panel tells you how many critical or warning issues are occurring for Nodes. Click on the Node Health link in the Node Health panel to drill into the Tiers & Nodes dashboard.
 .
.
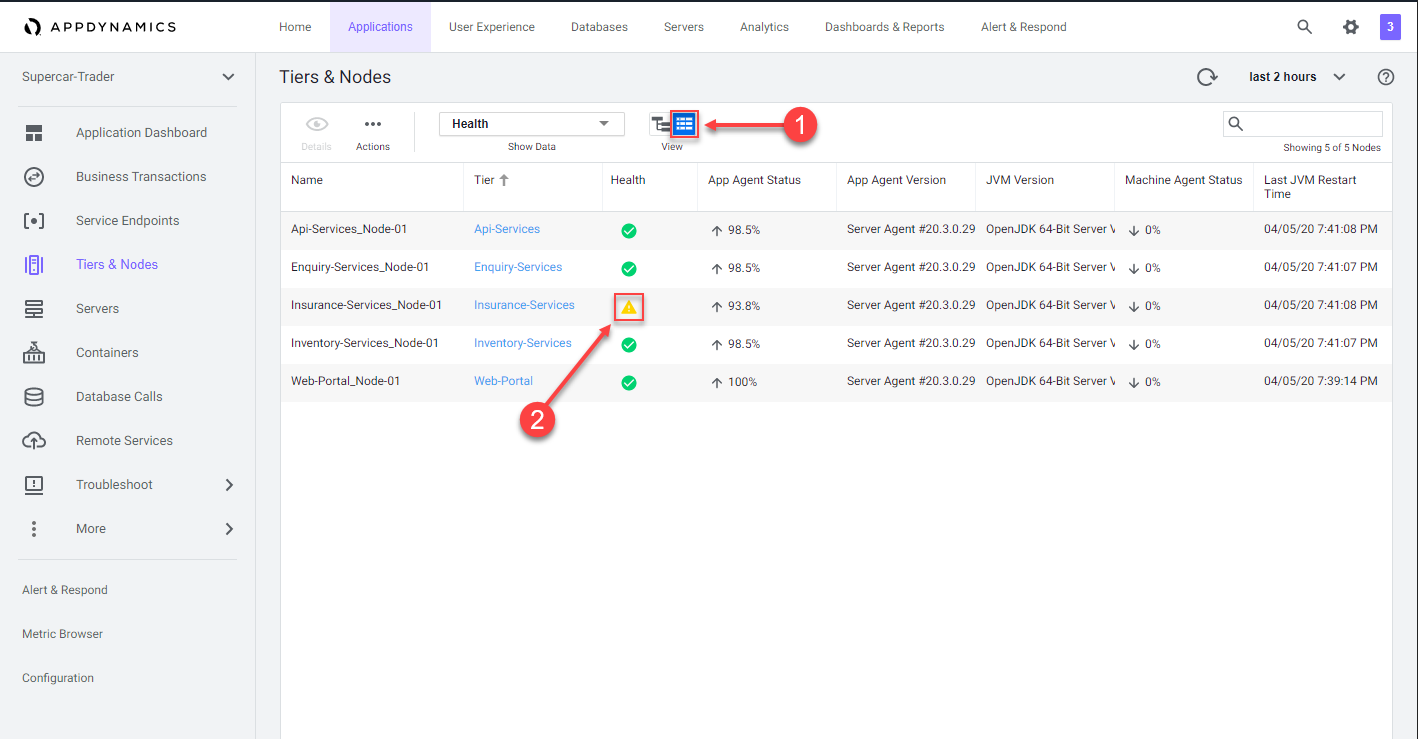
You can see the list of all the Nodes and find the Node that’s having an issue with these steps.
1 . Click on the Grid View button.
2 . Click on the warning icon for the Insurance-Services_Node-01 Node.
 .
.
The Health Rule Violations summary viewer shows all the violations for the Node within the context of the time frame you are viewing. In this case, there is only one violation.
1 . Click on the violation description
2 . Click on the Details button to see the details.
 .
.
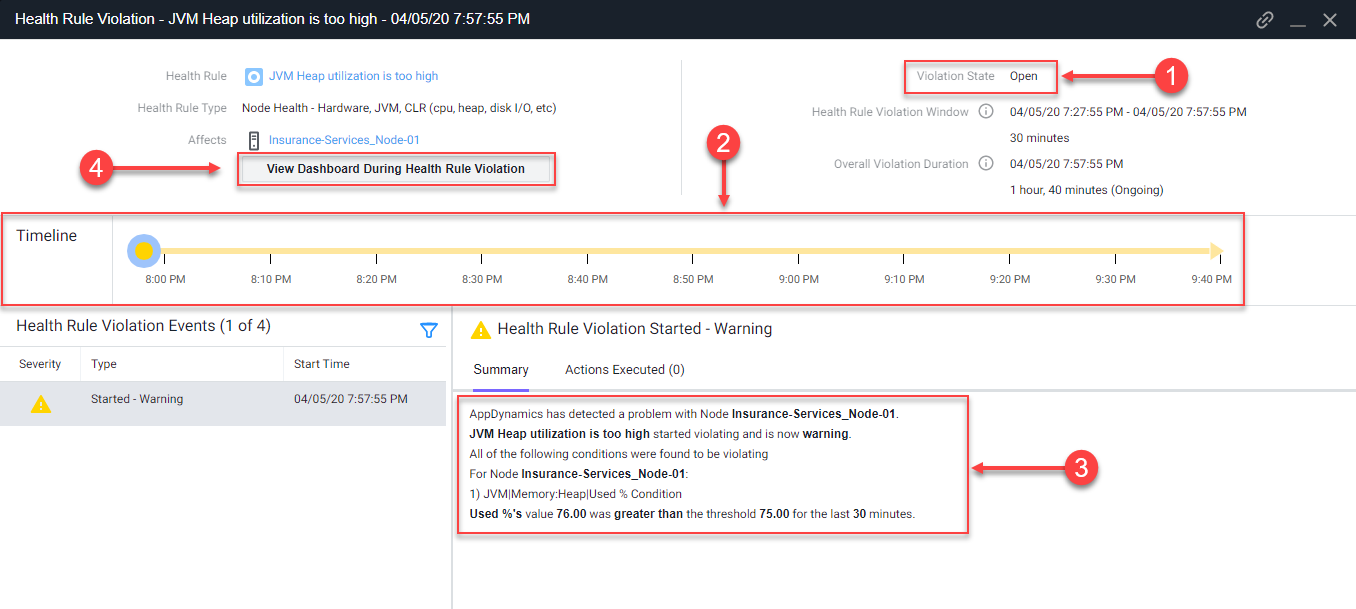
The Health Rule Violation details viewer shows you:
1 . The current state of the violation.
2 . The timeline of when the violation was occurring.
3 . The specifics of what the violation is and the conditions that triggered it.
4 . Click on the View Dashboard During Health Rule Violation button.
 .
.
When you click on the View Dashboard During Health Rule Violation button, it opens the Server tab of the Node dashboard by default.
If you haven’t installed the AppDynamics Server Visibility Monitoring agent yet then you won’t see the resource metrics for the host of the Node. You will be able to see those metrics in the next lab. The AppDynamics Java agent collects memory metrics from the JVM via JMX.
Investigate the JVM heap data using the steps below.
1 . Click on the Memory tab.
2 . Look at the current heap utilization.
3 . Notice the Major Garbage Collections that have been occurring.
Note: If you have an issue seeing the Memory screen, try using an alternate browser (Firefox should render correctly for Windows, Linux, and Mac).
 .
.
4 . Use the outer scroll bar to scroll to the bottom of the screen.
5 . Notice that the PS Old Gen memory space is at 100%.
You can read more about Node and JVM monitoring here and here.
 .
.
You have now completed this lab!
Next
We’ll install the AppDynamics Server Visibility Agent in the next lab to quickly see underlying infrastructure issues impacting application performance.