Initialize Sample Application
In this exercise you will perform the following actions:
- Install the sample application on Apache Tomcat.
- Start the load generation for the sample application.
- Confirm the transaction load in the Controller.
Install application on Apache Tomcat
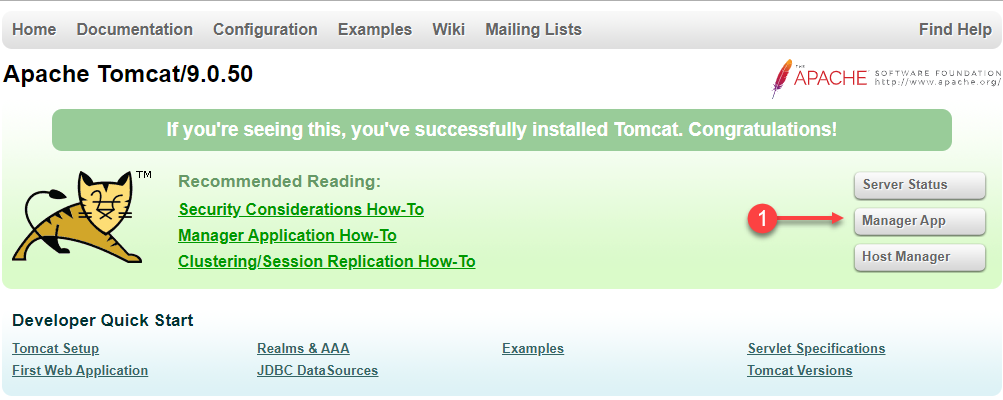
The Apache Tomcat landing page can be accessed through your web browser with a URL in the format like below.
http://[application-vm-ip-address]:8080Use the IP address of your Application VM to access the landing page. You should see the Tomcat landing page.
1 . Click Manager App.
2 . You will be prompted to enter a username and password. Use following the case sensitive credentials to login to the Tomcat Manager App.
- Username: admin
- Password: welcome1
If you are using a Cloud9 instance, you can select “Preview > Preview Running Application” from the top Cloud9 menu to open the Tomcat web page.
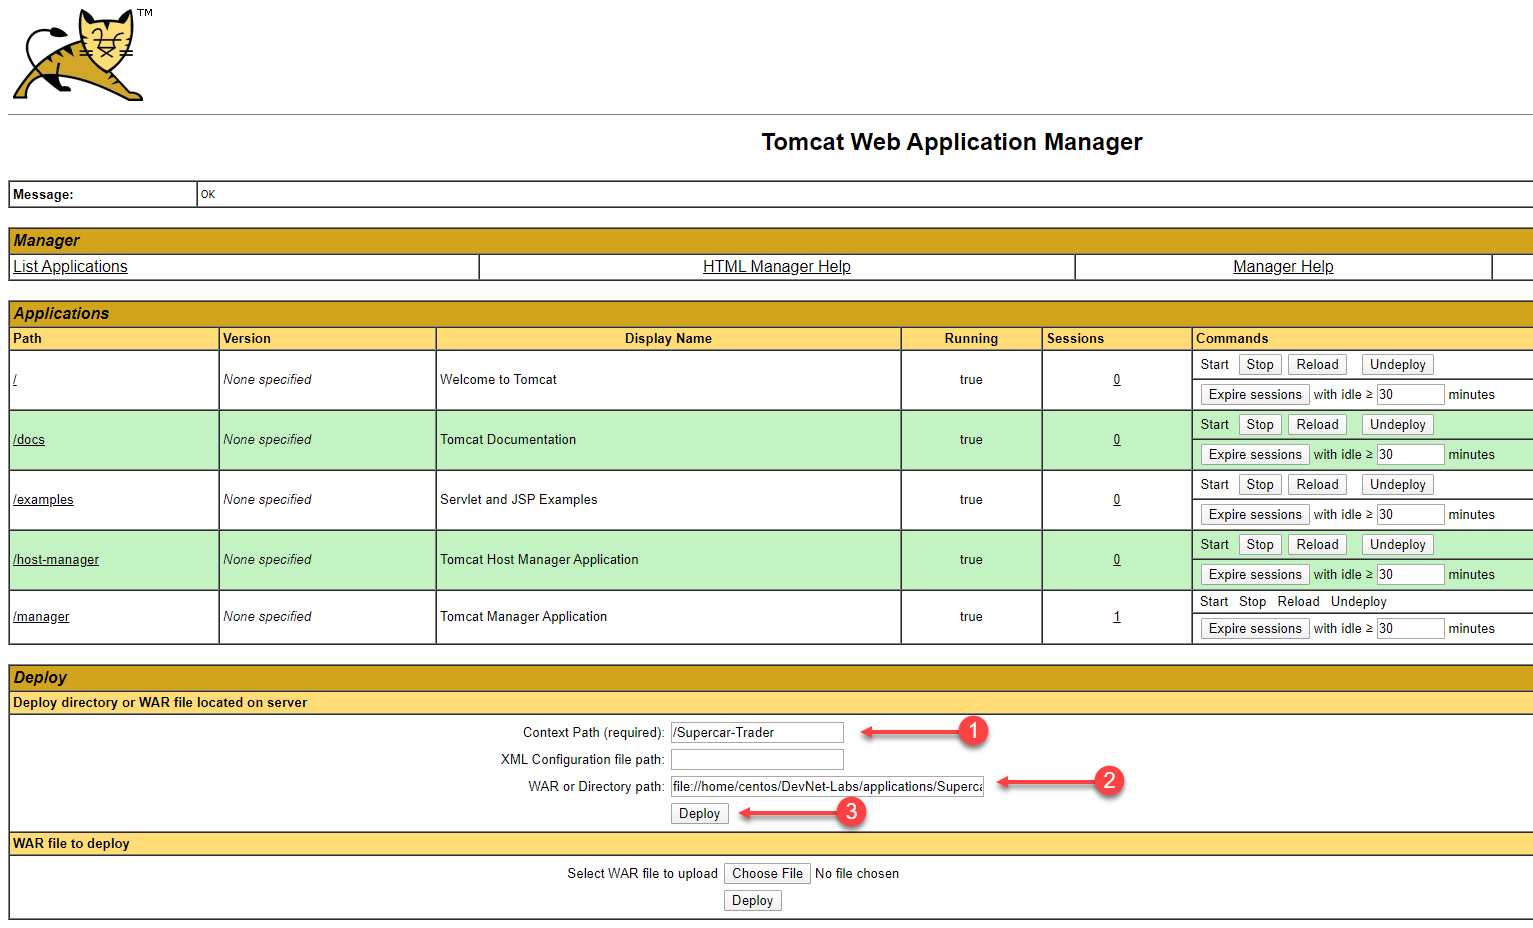
You should now see the Tomcat Manager App page.
1 . Enter /Supercar-Trader in the Context Path (required): field.
2 . Enter the following path in the WAR or Directory path: field.
file://opt/appdynamics/lab-artifacts/app-war-file/Supercar-Trader.war3 . Click the Deploy button.
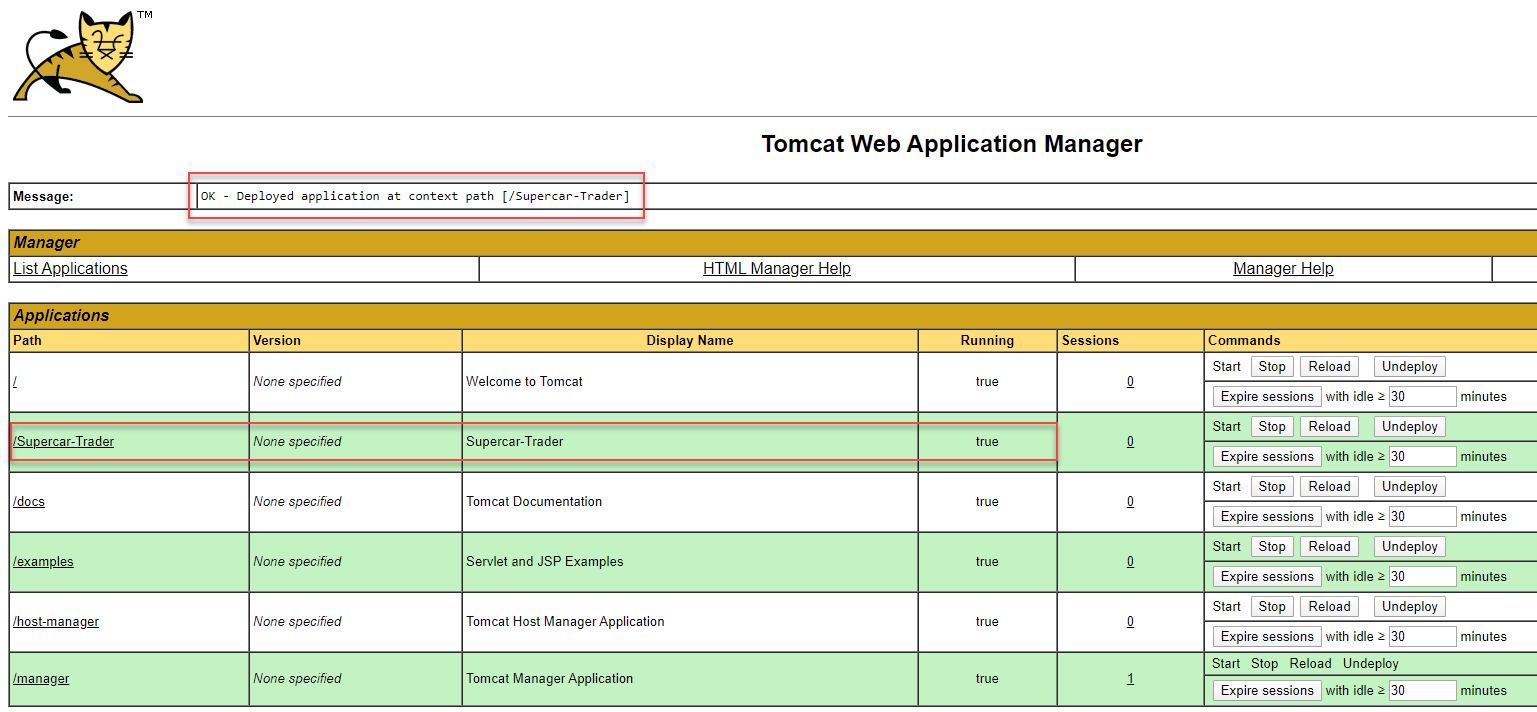
Once the deployment is completed, you should see the application running as shown in the following image.
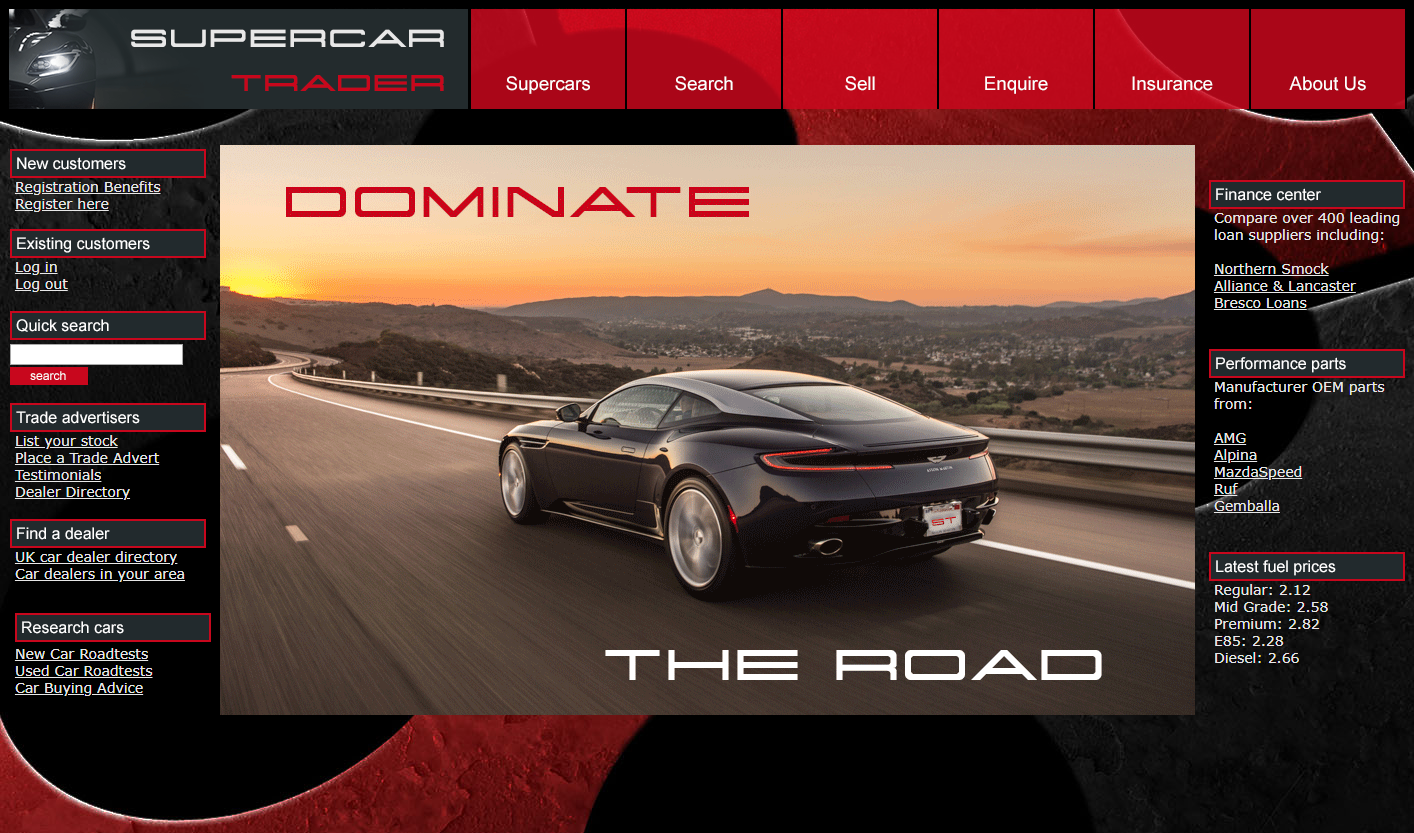
The sample application home page is accessible through your web browser with a URL in the format seen below. Enter that URL in your browser’s navigation bar, substituting the IP Address of your Application VM.
http://[application-vm-ip-address]:8080/Supercar-Trader/home.doYou should see the home page.
If you are using a Cloud9 instance, you can select “Preview > Preview Running Application” from the top Cloud9 menu. You can then click in the URL bar to see the URL fo the Tomcat web page. Copy that URL in a new browser tab and modify it so it includes the port and suffix of the main Supercars web page like the example below:
https://f087f1dbbb8b4b4a820e476d9017a8ca.vfs.cloud9.ap-southeast-1.amazonaws.com:8080/Supercar-Trader/home.doStart the load generation for the sample application
Initiate the transaction load for the application using the commands below.
sudo chmod 754 /opt/appdynamics/lab-artifacts/phantomjs/*.sh
sed -i -e 's/\r$//' /opt/appdynamics/lab-artifacts/phantomjs/*.sh
cd /opt/appdynamics/lab-artifacts/phantomjs
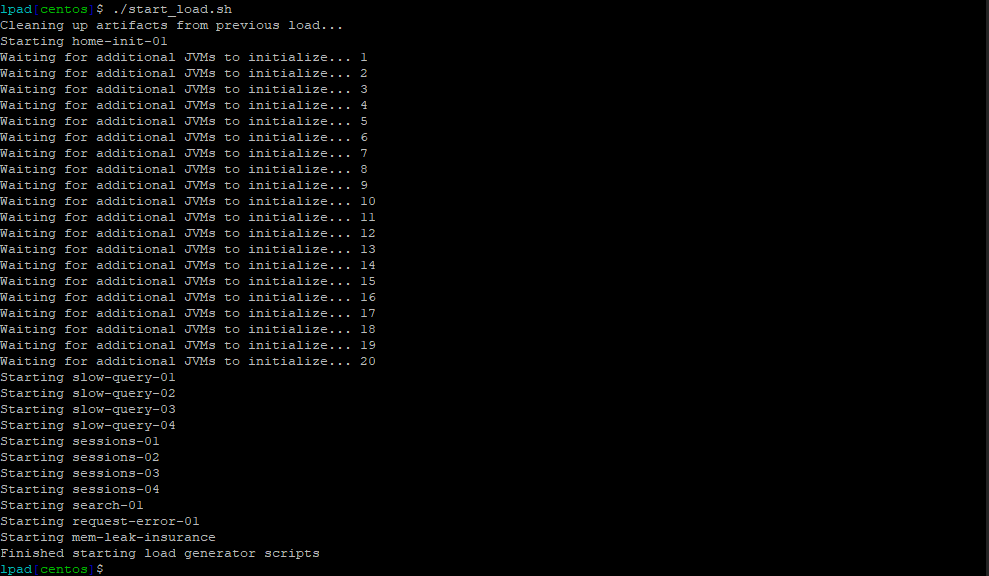
./start_load.shYou should see similar to the following.
Confirm the transaction load in the Controller
Use your web browser to access the AppDynamics Controller.
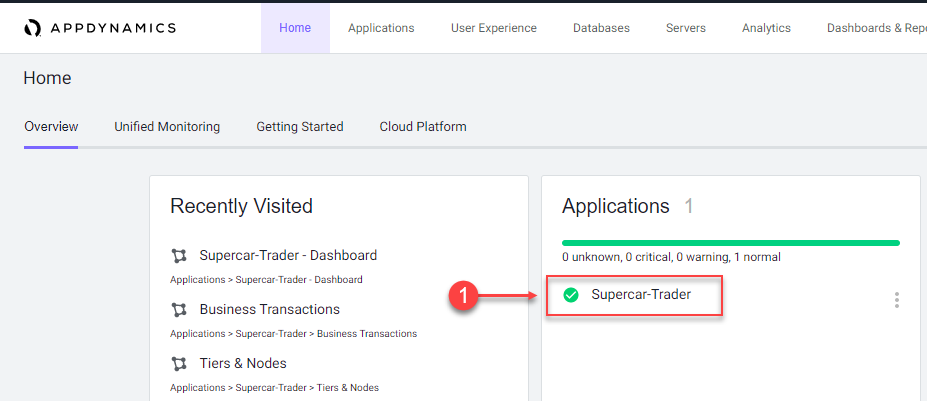
Login to the Controller and you should see the Supercar-Trader application.
1 . Double-click on the Supercar-Trader application to open the application flow map.
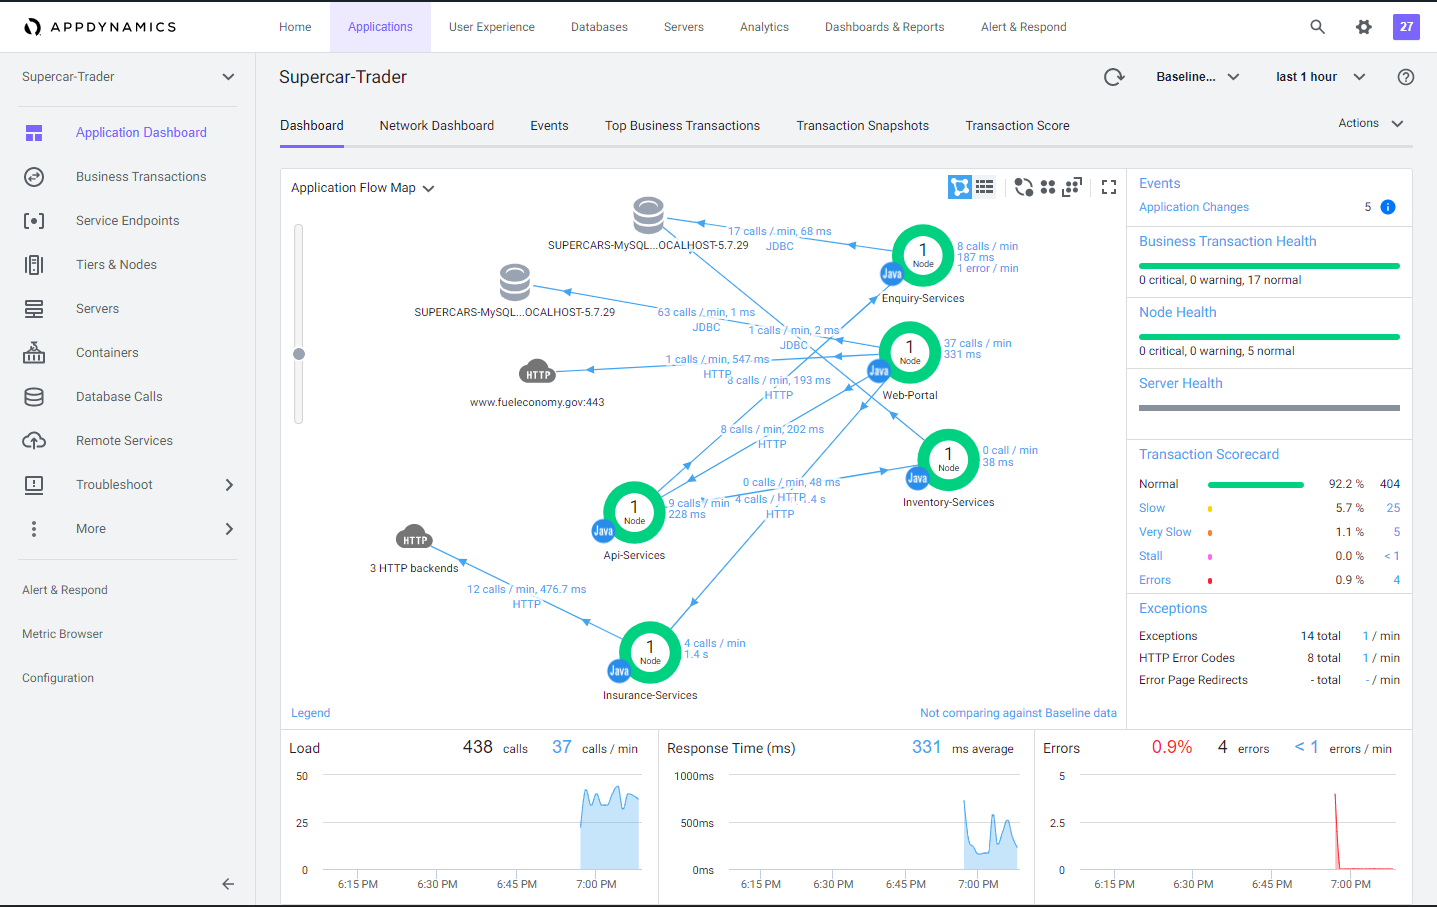
When you open the flow map for the application, you should see all the application components appear after twelve minutes.
If you don’t see all the application components after twelve minutes, try waiting a few more minutes and refresh your browser tab.
In the last exercise, you updated the controller-info.xml file to assign a Tier name and Node name to the Tomcat JVM.
<tier-name>Web-Portal</tier-name>
<node-name>Web-Portal_Node-01</node-name>
You might be wondering how the other four services had their Tier and Node name assigned. The sample application dynamically creates four additional JVMs from the initial Tomcat JVM and assigns the Tier and Node names by passing those properties into the JVM startup command as -D properties for each of the four services. Any -D properties included on the JVM startup command line will supersede the properties defined in the Java agents controller-info.xml file.
To see the JVM startup parameters used for each of the four services that were dynamically started, issue the following command in your terminal window of your Application VM.
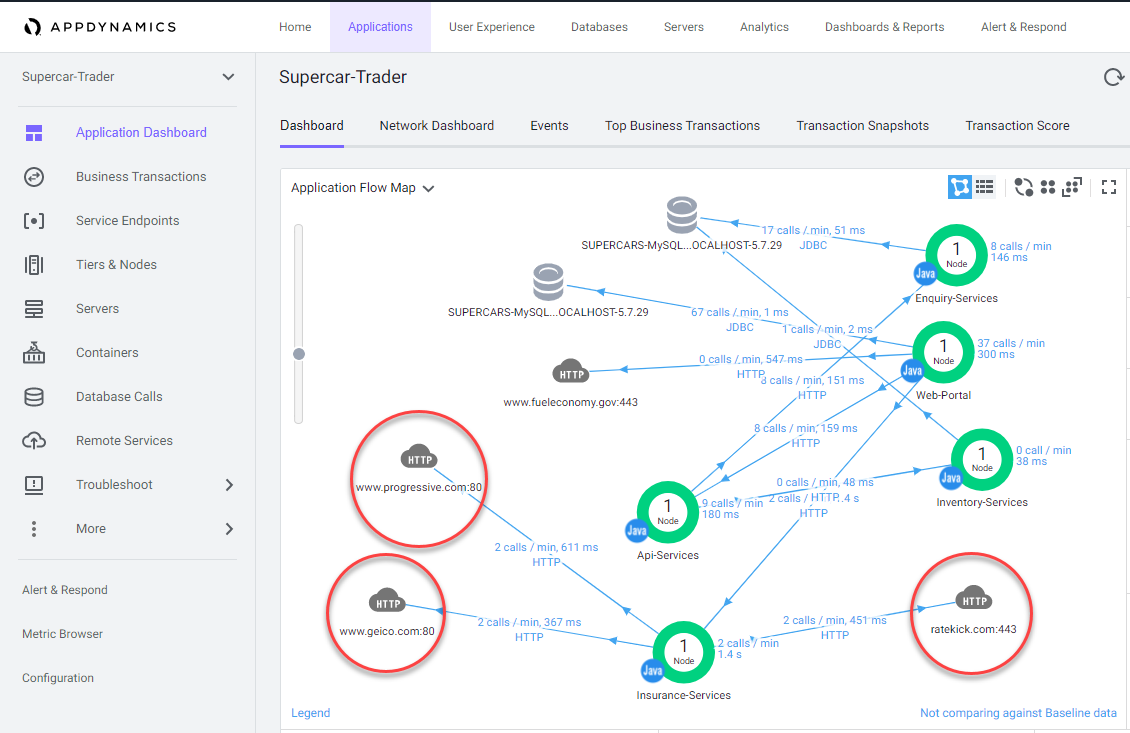
ps -ef | grep appdynamics.agent.tierNameOnce all of the components appear on the flow map, you should see an HTTP cloud icon that represents the three HTTP backends called by the Insurance-Services Tier.
Ungroup the the three HTTP backends by following these steps.
1 . Right click the HTTP cloud icon labeled 3 HTTP backends
2 . From the drop down menu, select Ungroup Backends
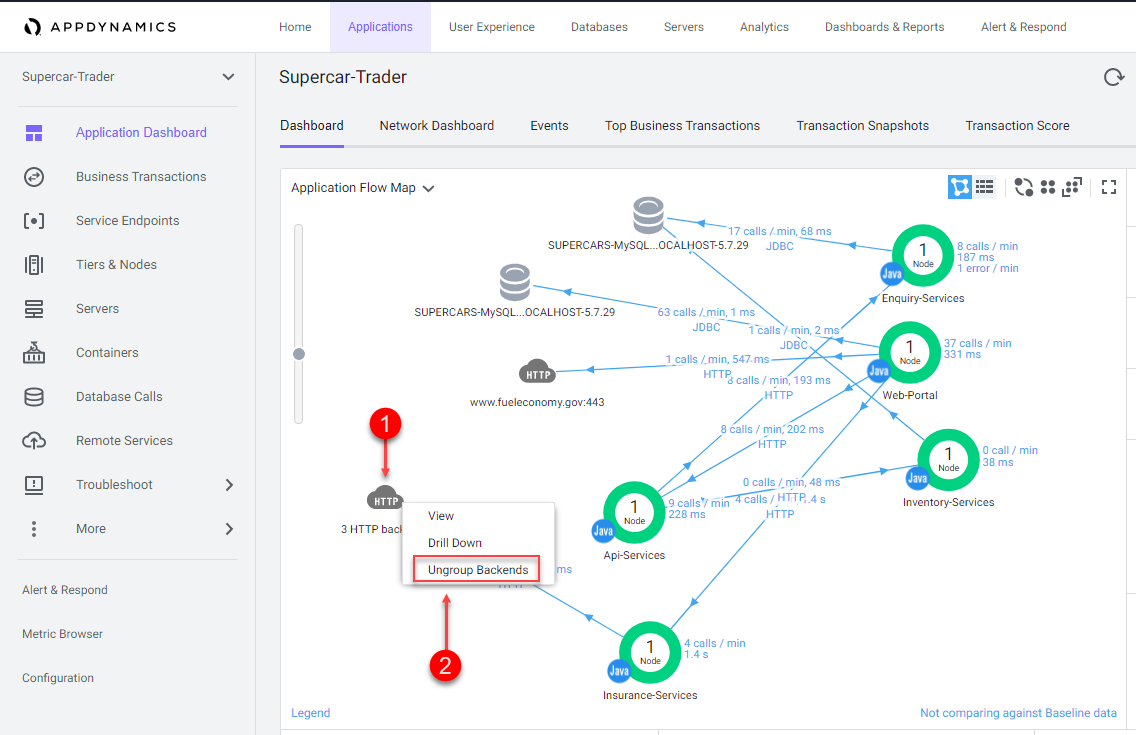
Once the HTTP backends have been ungrouped, you should see all three HTTP backends as shown in the following image.
Flow maps
AppDynamics app agents automatically discover the most common application frameworks and services. Using built-in application detection and configuration settings, agents collect application data and metrics to build flow maps.
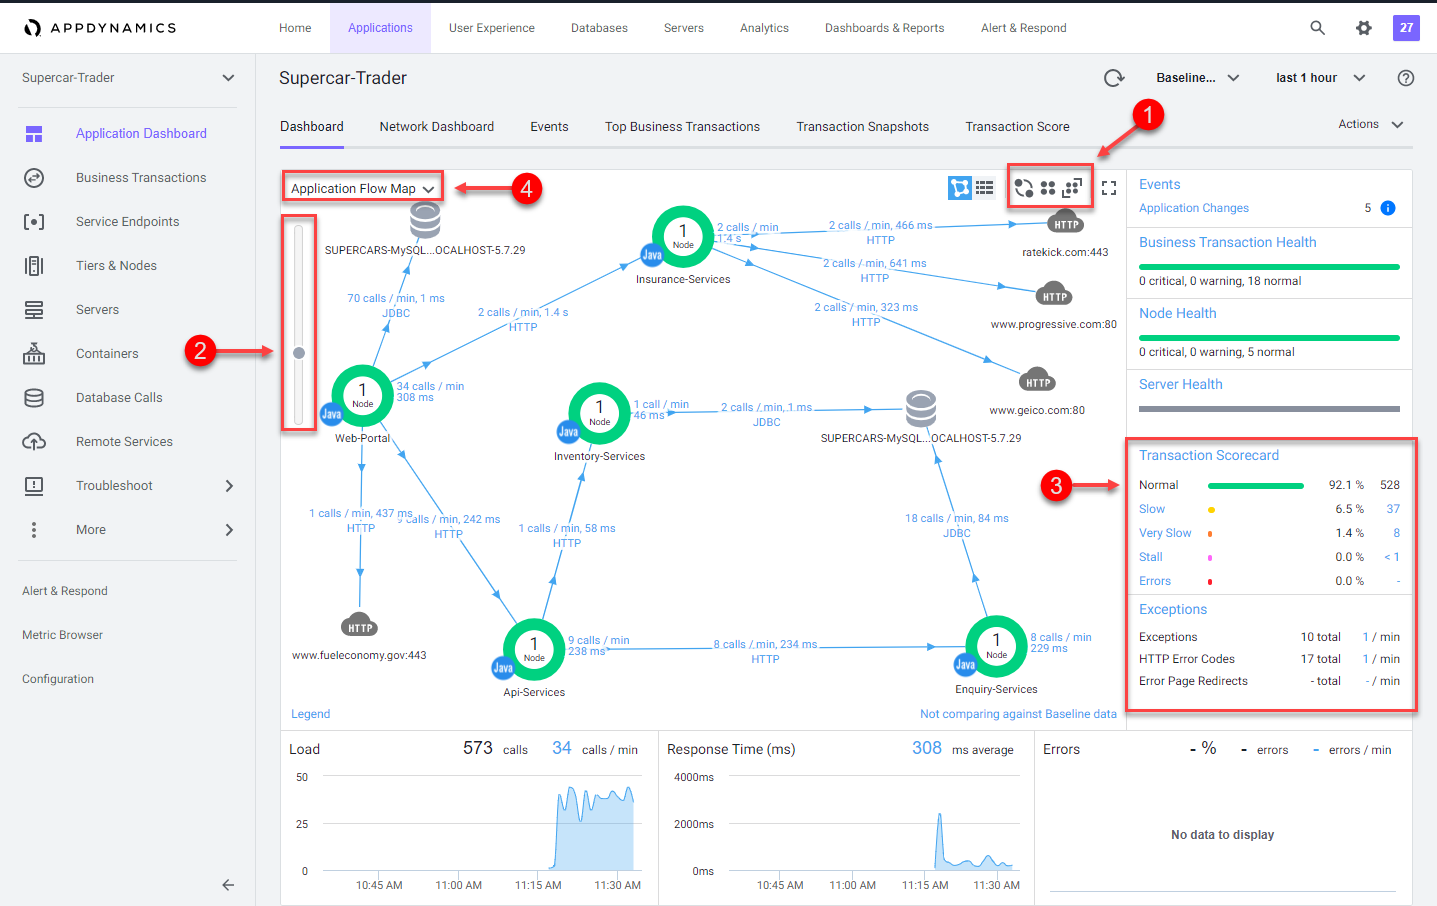
AppDynamics automatically captures and scores every transaction. Flow maps present a dynamic visual representation of the components and activities of your monitored application environment in direct context of the time frame that you have selected.
Familiarize yourself with the some of the different features of the Flow Map.
1 . Try using the different layout options (you can also click and drag each icon on the flow map to position it)
2 . Try using the slider to adjust the zoom level
3 . Look at the Transaction Scorecard
4 . Explore the options for editing the flow map
You can read more about Flow Maps here
Verifying business transactions
In the AppDynamics model, a business transaction represents the data processing flow for a request, most often a user request. In real-world terms, many different components in your application may interact to provide services to fulfill the following types of requests:
- In an e-commerce application, a user logging in, searching for items or adding items to the cart.
- In a content portal, a user requests content such as sports, business or entertainment news..
- In a stock trading application, operations such as receiving a stock quote, buying or selling stocks.
Because AppDynamics orients performance monitoring around business transactions, you can focus on the performance of your application components from the user perspective. You can quickly identify whether a component is readily available or if it is having performance issues. For instance, you can check whether users are able to log in, check out or view their data. You can see response times for users, and the causes of problems when they occur.
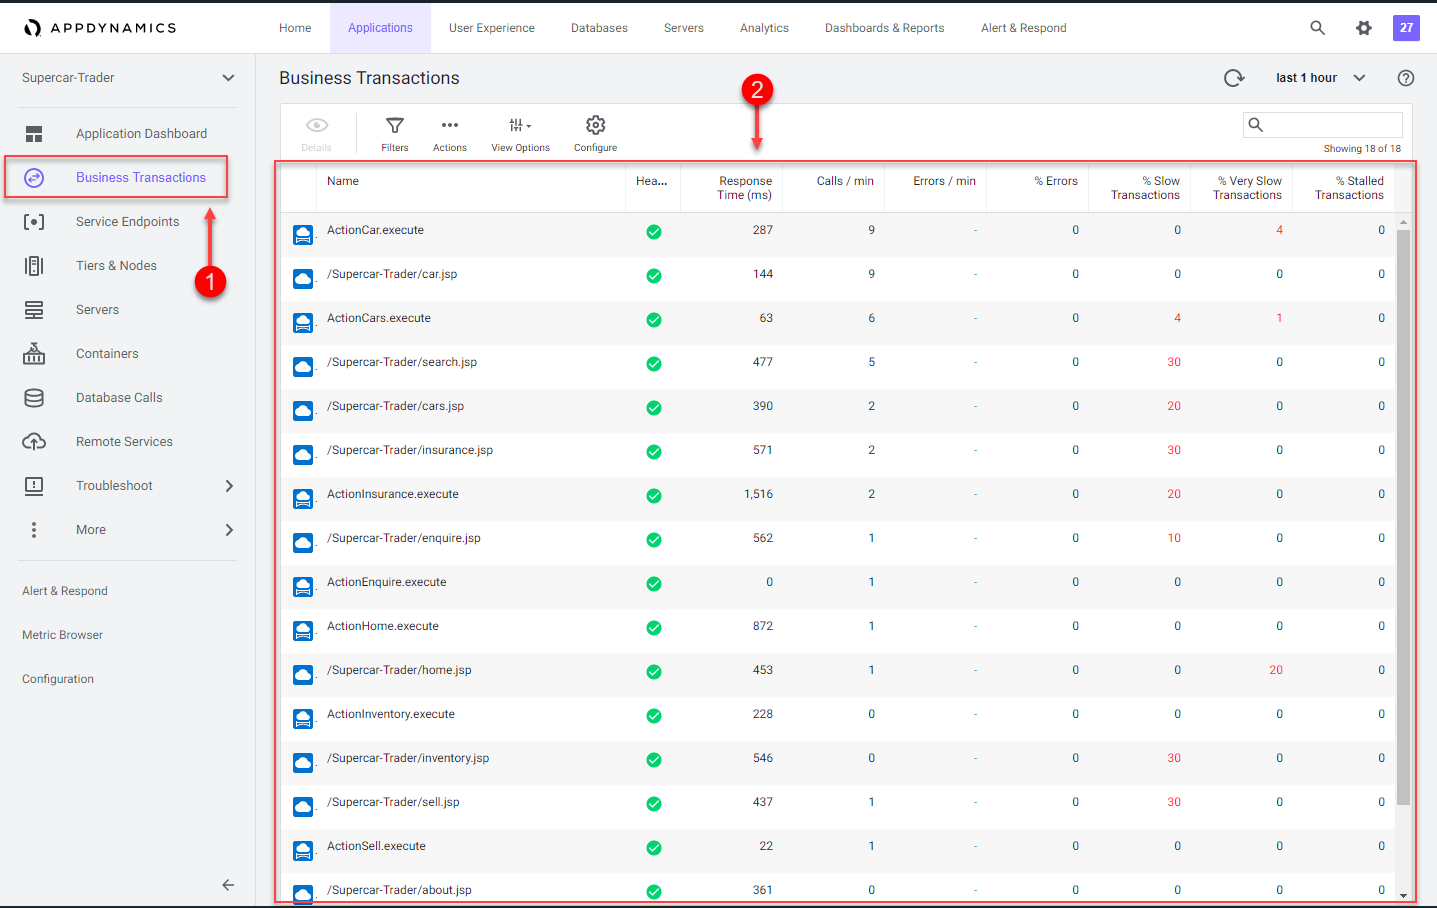
Verify that business transactions are being automatically detected by following these steps.
1 . Click the Business Transactions option on the left menu.
2 . Look at the list of Business Transactions and their performance.
You can read more about Business Transactions here and here
Snapshots
AppDynamics monitors every execution of a business transaction in the instrumented environment, and the metrics reflect all such executions. However, for troubleshooting purposes, AppDynamics takes snapshots (containing deep diagnostic information) of specific instances of transactions that are having problems.
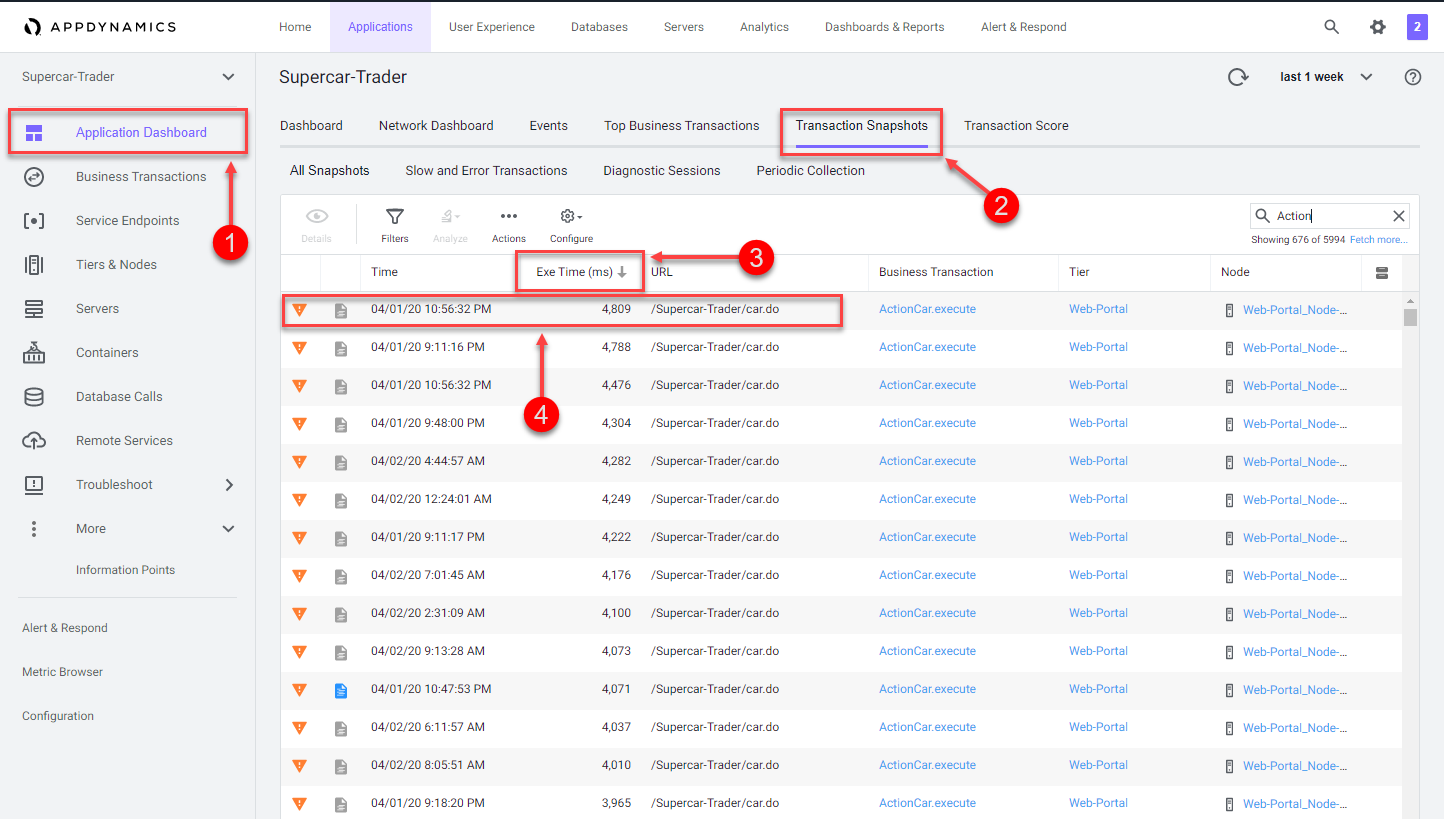
Verify that transaction snapshots are being automatically collected by following these steps.
1 . Click the Application Dashboard option on the left menu.
2 . Click the Transaction Snapshots tab.
3 . Click the Exe Time (ms) column to sort the snapshots with the greatest execution time.
4 . Double-click a business transaction snapshot to display the snapshot viewer.
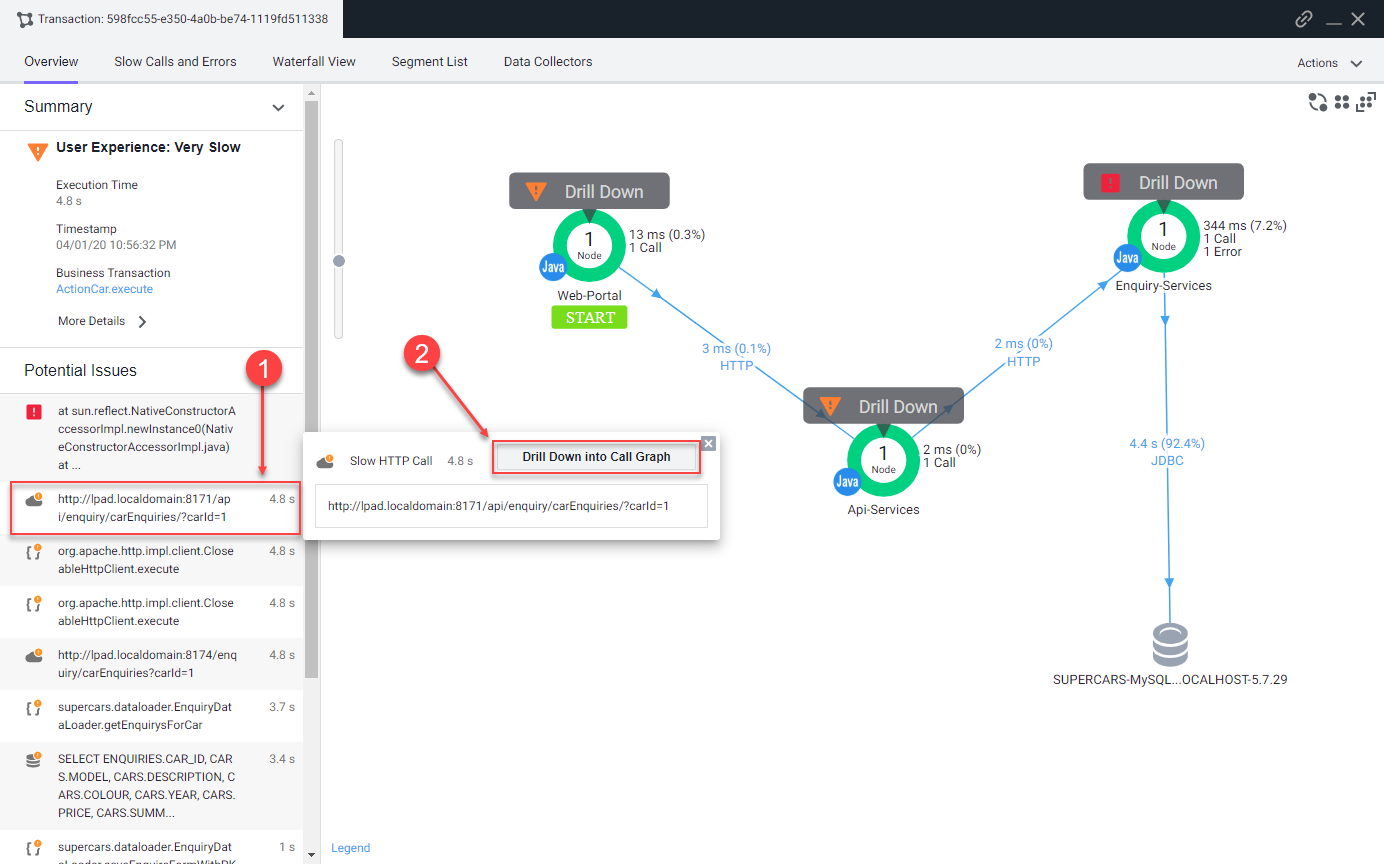
A transaction snapshot gives you a cross-tier view of the processing flow for a single invocation of a transaction.
The Potential Issues panel highlights slow methods and slow remote service calls and help you investigate the root cause for performance issues.
Drill downs
Call drill downs provide key information, including slowest methods, errors, and remote service calls for the transaction execution on a tier. A drill down may include a partial or complete call graph. Call graphs reflect the code-level view of the processing of the business transaction on a particular tier.
In the flow map for a business transaction snapshot, a tier with a Drill Down link indicates AppDynamics has taken a call graph for that tier.
Drill down into a call graph of the transaction snapshot by following these steps.
1 . Click on a slow call in the Potential Issues list on the left.
2 . Click Drill Down into Call Graph.
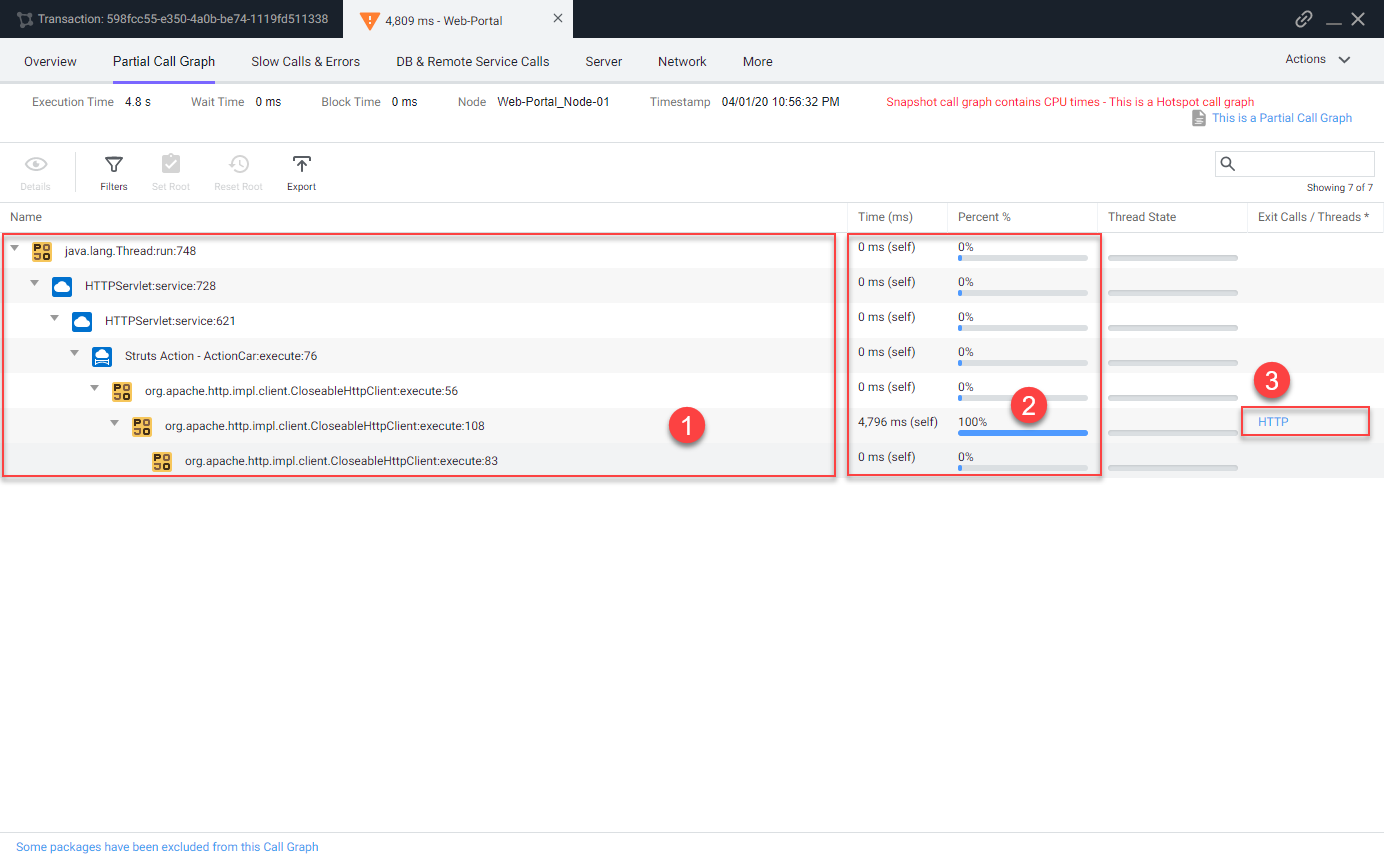
The call graph view shows you the following details.
1 . The method execution sequence shows the names of the classes and methods that participated in processing the business transaction on this node, in the order in which the flow of control proceeded.
2 . For each method, you can see the time and percentage spent processing and the line number in the source code, enabling you to pinpoint the location in the code that could be affecting the performance of the transaction.
3 . The call graph displays exit call links for methods that make outbound calls to other components such as database queries and web service calls.
You can read more about Transaction Snapshots here
You can read more about Call Graphs here
Next
We’ll configure collection settings in the Controller.